

Here We Are, Idaho
I’ll start by introducing myself:
I have been a mathematics professor at the University of Idaho since 2007. My primary research area is number theory, a beautiful and esoteric subject which asks deceptively simple questions about the symmetries of numbers and possible relationships between them. (If you have a spare hour, here is a video of a colleague’s math club seminar with the ambitious title “What is number theory?”) I have also had a growing interest in modeling and data science, so when the call was put out to help understand the nature and state of our current pandemic, I signed up. At the time, we all hoped that the epidemic in the United States might be contained to a few urban areas. Unfortunately, summer brought an increase in cases across the Unites States, including Idaho.
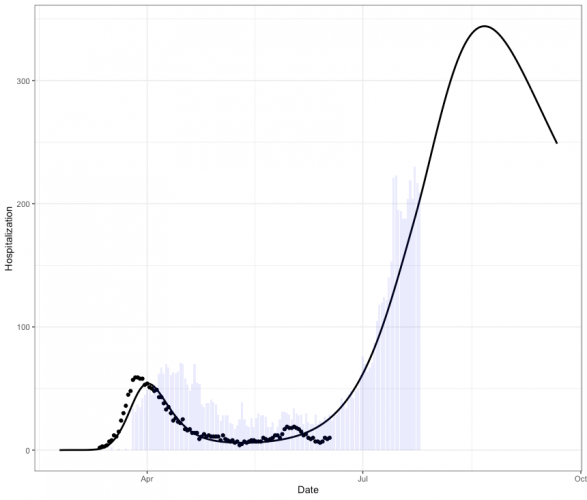
Our team has spent the last five months wading through the torrent of literature on COVID-19, participating in daily meetings with the UT COVID Modeling Consortium, and of course building, updating and maintaining models of COVID-19. The graph on this page is the output from the most recent forecast of our SEIR model. The y-axis is the daily hospitalizations from COVID-19 in Idaho, and the dots and bars are from two different data streams. If you follow the state-wide tableau data closely, you may have noticed that our daily cases seems to be leveling off, while this graph shows the hospitalizations peaking around the third week of August. Explaining this and similar phenomena, as well as the vocabulary and mathematics that are essential to understanding the COVID-19 pandemic, is the goal of this journal. I’d also love to answer your questions, so comment away!
As a final shameless plug, I will be the speaker for this semester’s first Renfrew Colloquium on August 25. We’ll talk about what models are and what types of models are helpful in responding to the COVID-19 pandemic. I hope you can attend!
UPDATE: Here’s the video of the talk.
Jennifer Johnson-Leung is a mathematics professor who uses models to explain and understand complex systems and to bring abstract concepts into focus for a wide audience.