

FOR DAILY EXPOSURE RISK MAPS, GO TO THE EXPOSURE RISK DASHBOARD
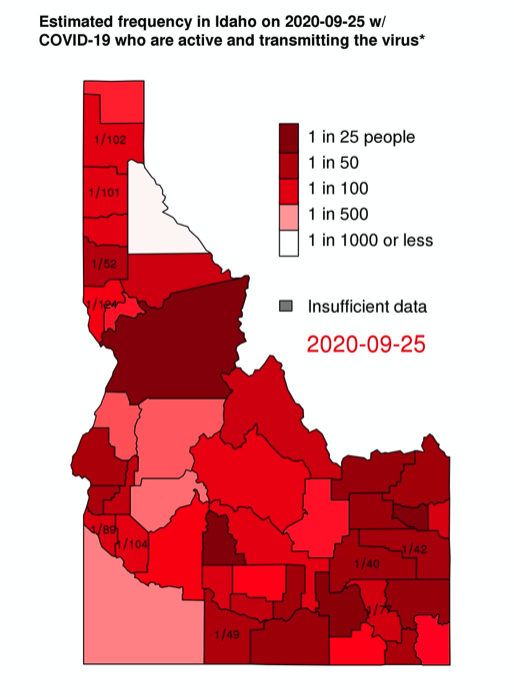
GOAL: To estimate the frequency of people in the community that are infectious with SARS CoV-2 and are either unaware they are infected or, despite mild symptoms, are not isolating.
INSPIRATION: The idea for this risk map is to build upon the risk map of Prof. Joshua Weitz and Prof. Clio Andris at the Georgia Institute of Technology. Their maps can be found here.
DATA: The data for this map is pulled every day from the NY Times github located at https://github.com/nytimes/covid-19-data.
METHODS: To estimate this frequency, we make the following assumptions.
1. Proportion of confirmed cases = \(p(\text{detect} | \text{infected}) = 0.1~~ (\text{bounds}~0.05 – 0.2)\) : Havers et al. (2020) analyzed seroprevalence of SARS-CoV-2 antibodies in 10 regions of the US. By comparing seroprevalence to the number of detected cases, they estimated the following detection proportions: 9% in WA, 8% in NY, 6% in LA CA, 9% FL, 15% in PE, 4% in MO, 10% in UT, 11% in SF CA, 17% in CT, and 10% in MN. The mean of these values is 10% which we use as our point estimate. We use 5% and 20% as our lower and upper bounds.
2. Proportion asymptomatic and symptomatic COVID-19 = \(p(\rm{asymptomatic} | \rm{infected}) = 0.422 \) and \(p(\rm{symptomatic} | rm{infected}) = 0.578)\): Oran and Topol reviewed evidence from 16 different populations that were tested for SARS CoV-2. Nearly all the samples have some shortcomings: either they are not representative of the larger population or they defined asymptomatic narrowly as those not having symptoms up to the point of testing. Of the samples, only the one from Vo’ Italy was both representative and followed people longitudinally to confirm whether symptoms developed. Of the 102 people who tested positive from Vo’, 43, or 42.2%, never showed symptoms. This implies that 57.8% of infections were symptomatic.
3. Proportion of clinically- and subclinically-symptomatic COVID-19: Only a fraction of people who develop COVID-19 symptoms become severely ill. We assume that 10% of all infections are detected (see point 1). We assume that this 10% represents people who became ill enough to get tested. We call these “clinically symptomatic.” This implies that, among all infected people, the probability they will be clinically symptomatic is \(p(\rm{clinically~symptomatic} | \rm{infected}) = 0.1.\) We call the remaining symptomatic cases “subclinically symptomatic”. $$\begin{align} p(\text{subclinically symptomatic} | \text{infected}) &= 1 – p(\text{clinically symptomatic} | \text{infected}) – p (\text{asymptomatic} | \text{infected}) \\ &= 1-0.1-0.422 = 0.478.\end{align}$$ Importantly in our model, these people have a choice to make about whether to isolate or not once they develop symptoms as their symptoms are not severe.
4. Infectious period is 10 days: on average 2.3 days before symptom onset and 7 days after: He et al. (2020) studied temporal patterns of viral shedding in 94 patients with laboratory-confirmed COVID-19 and modeled COVID-19 infectiousness profiles from a separate sample of 77 infector–infectee transmission pairs. They estimate that the infected person is infectious for an average of 2.3 days before symptom onset and for approximately 7 days after symptom onset. They estimate that a person reaches peak infectiousness about 0.7 days before symptom onset.
5. Clinically symptomatic infections are infectious for 2.3 days: See 4 above for justification of using of 2.3 days. A person who develops a clinically symptomatic COVID-19 infection is infectious before they develop symptoms. After they develop symptoms, we assume the severity of their illness forces them to isolate from the general public. This does not mean they cannot infect others in their home or a health care setting, but this model is focused estimating the frequency of infectious people that are not observably ill to others. Thus, if we imagine sampling a person who will ultimately become clinically symptomatic, the probability that they are infectious but not isolated at the moment of sampling is \(p(\rm{infectious}|\rm{clinically}~\rm{symptomatic})\)(= 2.3/10 = 0.23.)
6. The infectious period of subclinically symptomatic infections depends on people’s choice to isolate or not: A person who develops subclinical symptoms and chooses not to isolate is assumed to be infectious for 9 days: $$p(\text{infectious} | \text{subclinically symptomatic and not isolating} ) = 9/10 = 0.9.$$ A person who develops subclinical symptoms and chooses to isolate is assumed to be infectious for 2.3 days: $$ p(\text{infectious} | \text{subclinically symptomatic and isolating}) = 2.3/10 = 0.23.$$ We now need to know the probability someone will isolate or not. A PEW research poll from June 2020 found that, overall, 62% of respondents were either “very concerned” or “somewhat concerned” about unknowingly spreading COVID-19 to others. We assume that this is a good estimate of the proportion of people who, upon developing subclinical COVID-19 symptoms, will isolate. This implies that 38% of people with symptoms that are sub-clinical will not isolate. In order to calculate the probability that a person that has a subclinical symptomatic infection in infectious at a moment they are randomly sampled (or randomly encountered), we partition based on their willingness to isolate: $$ \begin{align} p(\text{infectious} |\text{subclinically symptomatic}) &= p(\text{infectious} | \text{subclinical and isolating}) p(\text{isolating})\\ &\quad+ p(\text{infectious} | \text{subclinical and not isolating}) p(\text{not isolating}) \\ &= (0.23)(0.62) + (0.9)(0.38) = 0.4846.\end{align} $$ This calculation relies on the assumption that the probability of isolating is independent of the probability of developing a subclinical infection.
7. Asymptomatic infections are infectious for 9 days: Little is know about the how asymptomatic infections differ from symptomatic ones. There is some data from He et al. (2020) that asymptomatic infections may be slightly less infectious and of shorter duration than symptomatic ones, but the results are not statistically significant. Until we have better data on the subject, we assume the duration of the two types of infection are the same. Thus, conditional on a person having an asymptomatic infection, the probability they are infectious is \(p(\rm{infectious} | \rm{asymptomatic}) = 0.9\).
ESTIMATION
1. Number of active cases, \(N(\rm{current~ infections})\) is estimated as the number of new confirmed cases in the last 10 days / \(p(\rm{detect})\).
2. Conditional on sampling a person with an active infection, what is the probability they are actively “out and about” in the community AND transmitting virus? This can be calculated from the probabilities given above: $$\begin{align} p(\text{infections} | \text{infected}) &=p(\text{infectious} | \text{asymptomatic}) p(\text{asymptomatic}) +p(\text{infectious} | \text{symptomatic}) p(\text{symptomatic}) \\ &=p(\text{infectious} | \text{asymptomatic}) p(\text{asymptomatic}) \\ &\quad +p(\text{infectious} | \text{clinically symptomatic}) p(\text{clinically symptomatic})\\ &\quad+p(\text{infectious} | \text{subclinically symptomatic})\\ &=(0.9)(0.422)+(0.23)(0.1) +(0.4846)(0.578) \\ &=0.380 + 0.023 + 0.232 \\ &= 0.634 \end{align} $$
In other words, we expect that 63% of active infections of COVID-19 are people who could be out in the community potentially transmitting virus. These are comprised of people who are asymptomatic, people who are presymptomatic, and people who have developed subclinical symptoms but chosen not to isolate.
3. RISK = 1/probability a random person one encounters in the community is infectious: $$\text{RISK}= \frac{1}{\text{frequency of infectious person}} = \frac{p(\text{infectious} | \text{infected}) N(\text{current infections})} {N(\text{county})}$$ where \(N(\text{active})\) is the estimated number of active cases and \(N(\text{county})\) is the population size of the county.
EXAMPLE
In Latah county, Idaho, there were 100 cumulative confirmed cases on 8/6/2020, 68 cumulative confirmed cases 10 days earlier on 7/27/2020–hence there were 26 new cases in that 10 day window. The number of active cases is estimated at 26/0.1=260 (bounds 130-520). The number of cases that are active and transmitting virus is (268)(0.634) = 169.9. (bounds 82.4 – 329.7) The size of Latah county is 39,239. So the frequency of people who are active and transmitting virus is 169.9/39239 = 0.00433 (bounds 0.00210 – 0.00840). We then take the reciprocal to make the frequency more readily interpretable in the form of 1 in (x) people in the county will be active and transmitting the virus: 1/0.00433 = 231 (bounds 476 – 119). Thus we estimate that as of 8/6/2020, 1 in 231 people in Latah County were infectious and potentially active in the community.
LIMITATIONS
Reading the assumptions above will reveal that there are a lot of parameters going into this estimation for which we have reasonable guesses, but not great data. Currently we only account for uncertainty in the detection ratio; it would be preferable to account for uncertainty in all our parameters. One parameter that is particularly important and not well understood is the proportion of people who isolate when they develop subclinical symptoms. If this is 95% instead of 62%, it would bring the proportion of current infections that are active and transmitting down to 52% (from 63%). Another important thing to recognize is that the detection ratio (here assumed to be 1 to 10) depends on the way cases are identified. Generally in the US, identification has been via people seeking out a test once they have developed symptoms. However, if the detection method changes substantially, the assumed detection probably would need to be changed. For example, if a large proportion of the population was sampled–say because they are university students and testing is required before they can attend class–then the detection ratio in this subpopulation would be much higher.